Mid Project
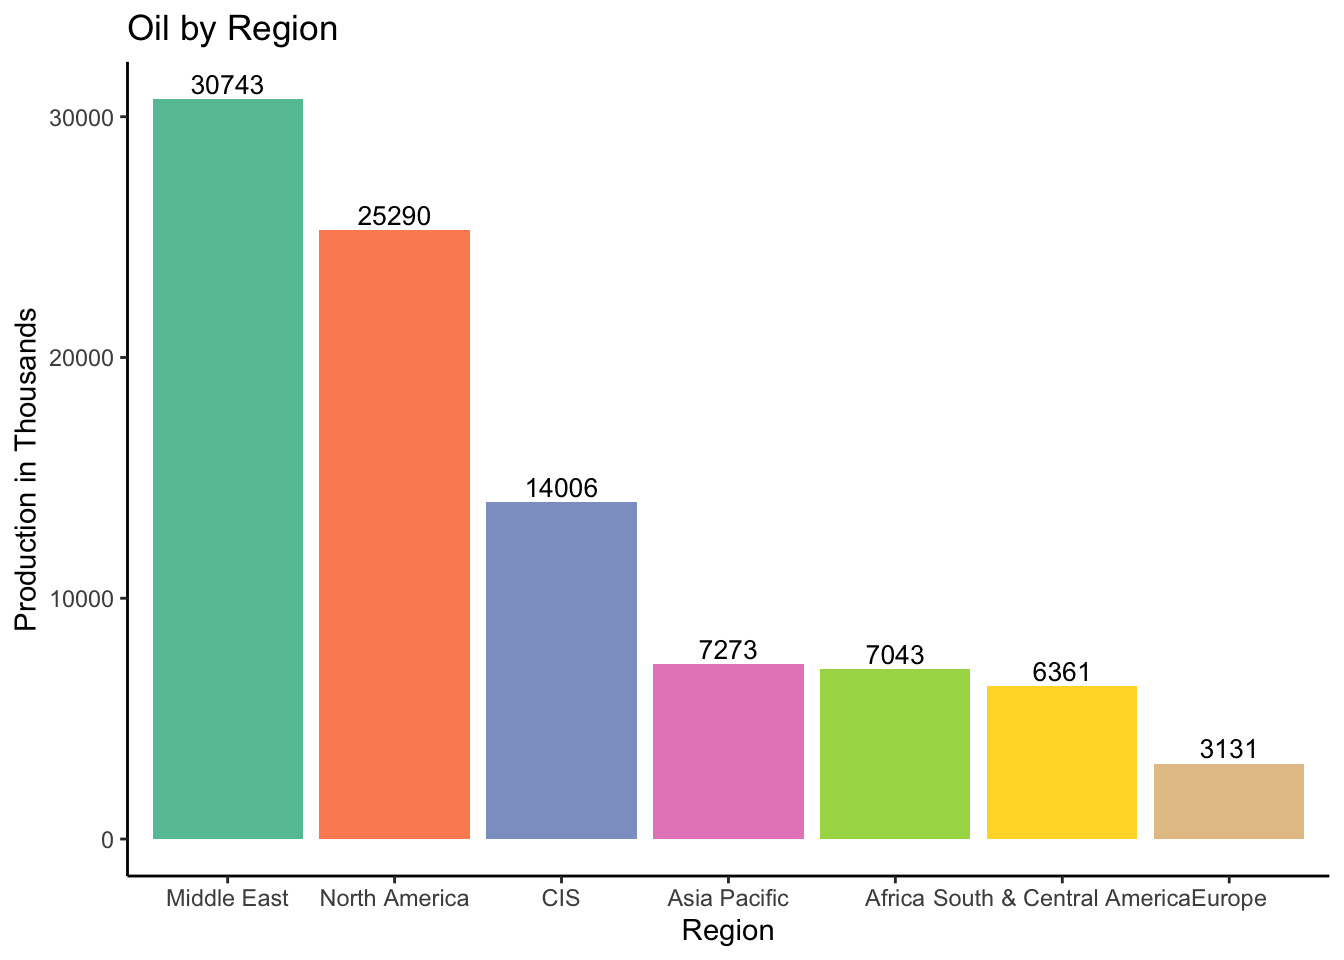
Chart 1 - Oil Breakdown by Region
This chart shows the production of oil by region in thousands barrels per day
Chart 2 - Breakdown of Oil Producers by Country
This chart presents the distribution of oil production in 2022, with the quantities measured in barrels per day. It highlights the United States as the top producer. The advantage of this graph is its ability to display the hierarchy of countries in terms of oil production.
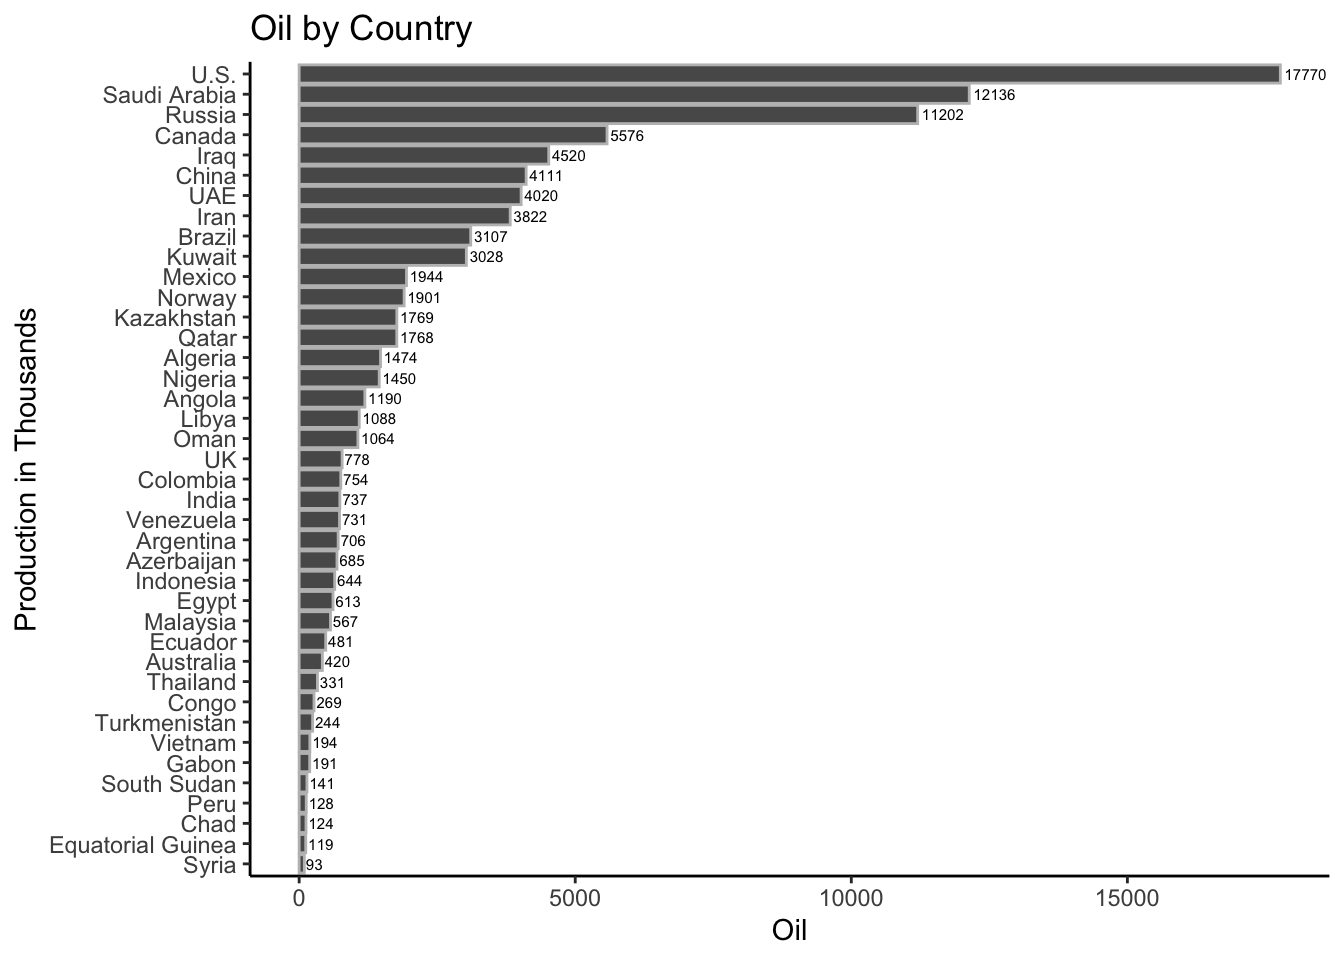
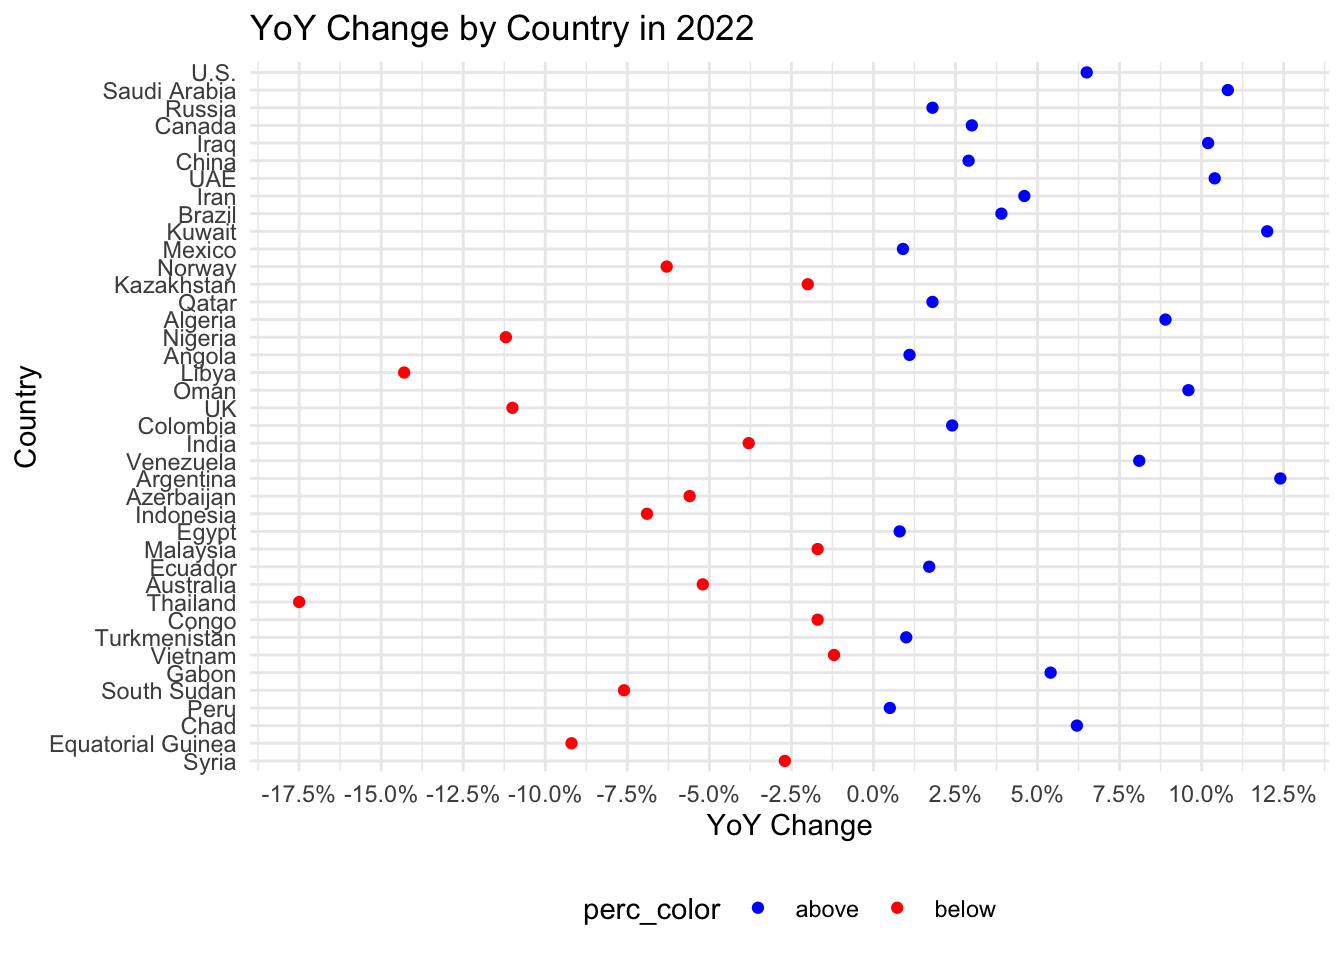
Chart 3 - Year over Year change by Country
This chart shows the year over year percent change with blue colors representing a positive percentage change and red showing a negative year over year change from the previous 2021 year.
Video
Reference
Rao, Pallavi. “Ranked: The World’s Biggest Oil Producers.” Elements by Visual Capitalist, 23 Sept. 2023, elements.visualcapitalist.com/ranked-the-worlds-biggest-oil-producers/.